During 1939–1940, at a dollar/drachma exchange rate of 1/112, the Greek economy recorded the following figures:
GDP: 65,000million drachmas, or $580.4 million.
Money in circulation: 9,500 million drachmas, or $84.4 million.
At the start of the German and Italian Occupation (1941–1942), the occupation forces demanded that Greece pay 1,500 million drachmas, or $10 million, every month for their upkeep. These were designated as Occupation expenses.
In addition, the German occupiers demanded further sums in cash or in goods, under the agreement that they would be returned. These were designated as Credits—Loans. In other words, occupied Greece was lending to its conqueror, Germany. Nothing comparable occurred in any other country of occupied Europe.
At the same time, Greece’s GDP fell dramatically—by more than 50%—with the result that the monthly expenses for the upkeep of the occupation forces and the Loans were covered by the issuance of new currency (inflation).
Monetary inflation did not significantly affect the real value of the German troops’ pay because the amounts they drew for their needs were adapted to the cost-of-living index and to price controls—i.e., they had greater purchasing power. As a result, there was a dramatic reduction in available resources (food, etc.) for the Greek population to the benefit of the German troops, and the rise of profiteering (the black market). For example, the Germans bought an egg for 5 drachmas under the price-control regime, while on the free (black) market its price exceeded 1,000 drachmas. By comparison, the monthly salaries of Greek civil servants were around 2,500 drachmas.
Overview of the German Occupation of Greece (1941–44):
Greece’s GDP in 1939–1940: 65,000 million drachmas or $580.4 million.
Greece’s GDP in 1941–1944: less than 35,000 million drachmas or $290 million.
Currency in circulation in 1939–1940: 9,500 million drachmas or $84.4 million.
Currency in circulation in 1944: more than 2,500,000,000 million drachmas, of which 1,617,781,093 million drachmas (64%) went to the German occupation forces as upkeep expenses or as loans.
The scale of the monetary collapse of the Greek economy was certified in October 1944, after the withdrawal of the German occupation forces from Greece, when a currency reform took place and new drachmas were issued at an exchange rate of 1 new drachma to 50 billion old ones.
Meanwhile Germany’s economy—though defeated—did not collapse as Greece’s did. In 1947, it carried out a monetary reform replacing the Reichsmark () with the Deutsche Mark (DM) at an exchange rate of 1 DM to 10 RM.
Greece (Oct 1944): currency revaluation from old to new drachma at 50,000,000,000:1.
Germany (June 1948): currency reform from RM to DM; most balances at 10:1.
According to reputable historians and economists of that era, the damage Greece suffered in 1941–1944—to its infrastructure, the reduction of its productive capital, the loss of savings, etc.—is estimated to be equivalent to 30 times the GDP of 1939–1940.
Greece lost 13.5% of its population during World War II.
Budget deficits rose from 4% in 1938 to 93% in 1944.
The Germans razed 1,770 villages (marked with red dots on the 1946 map below).
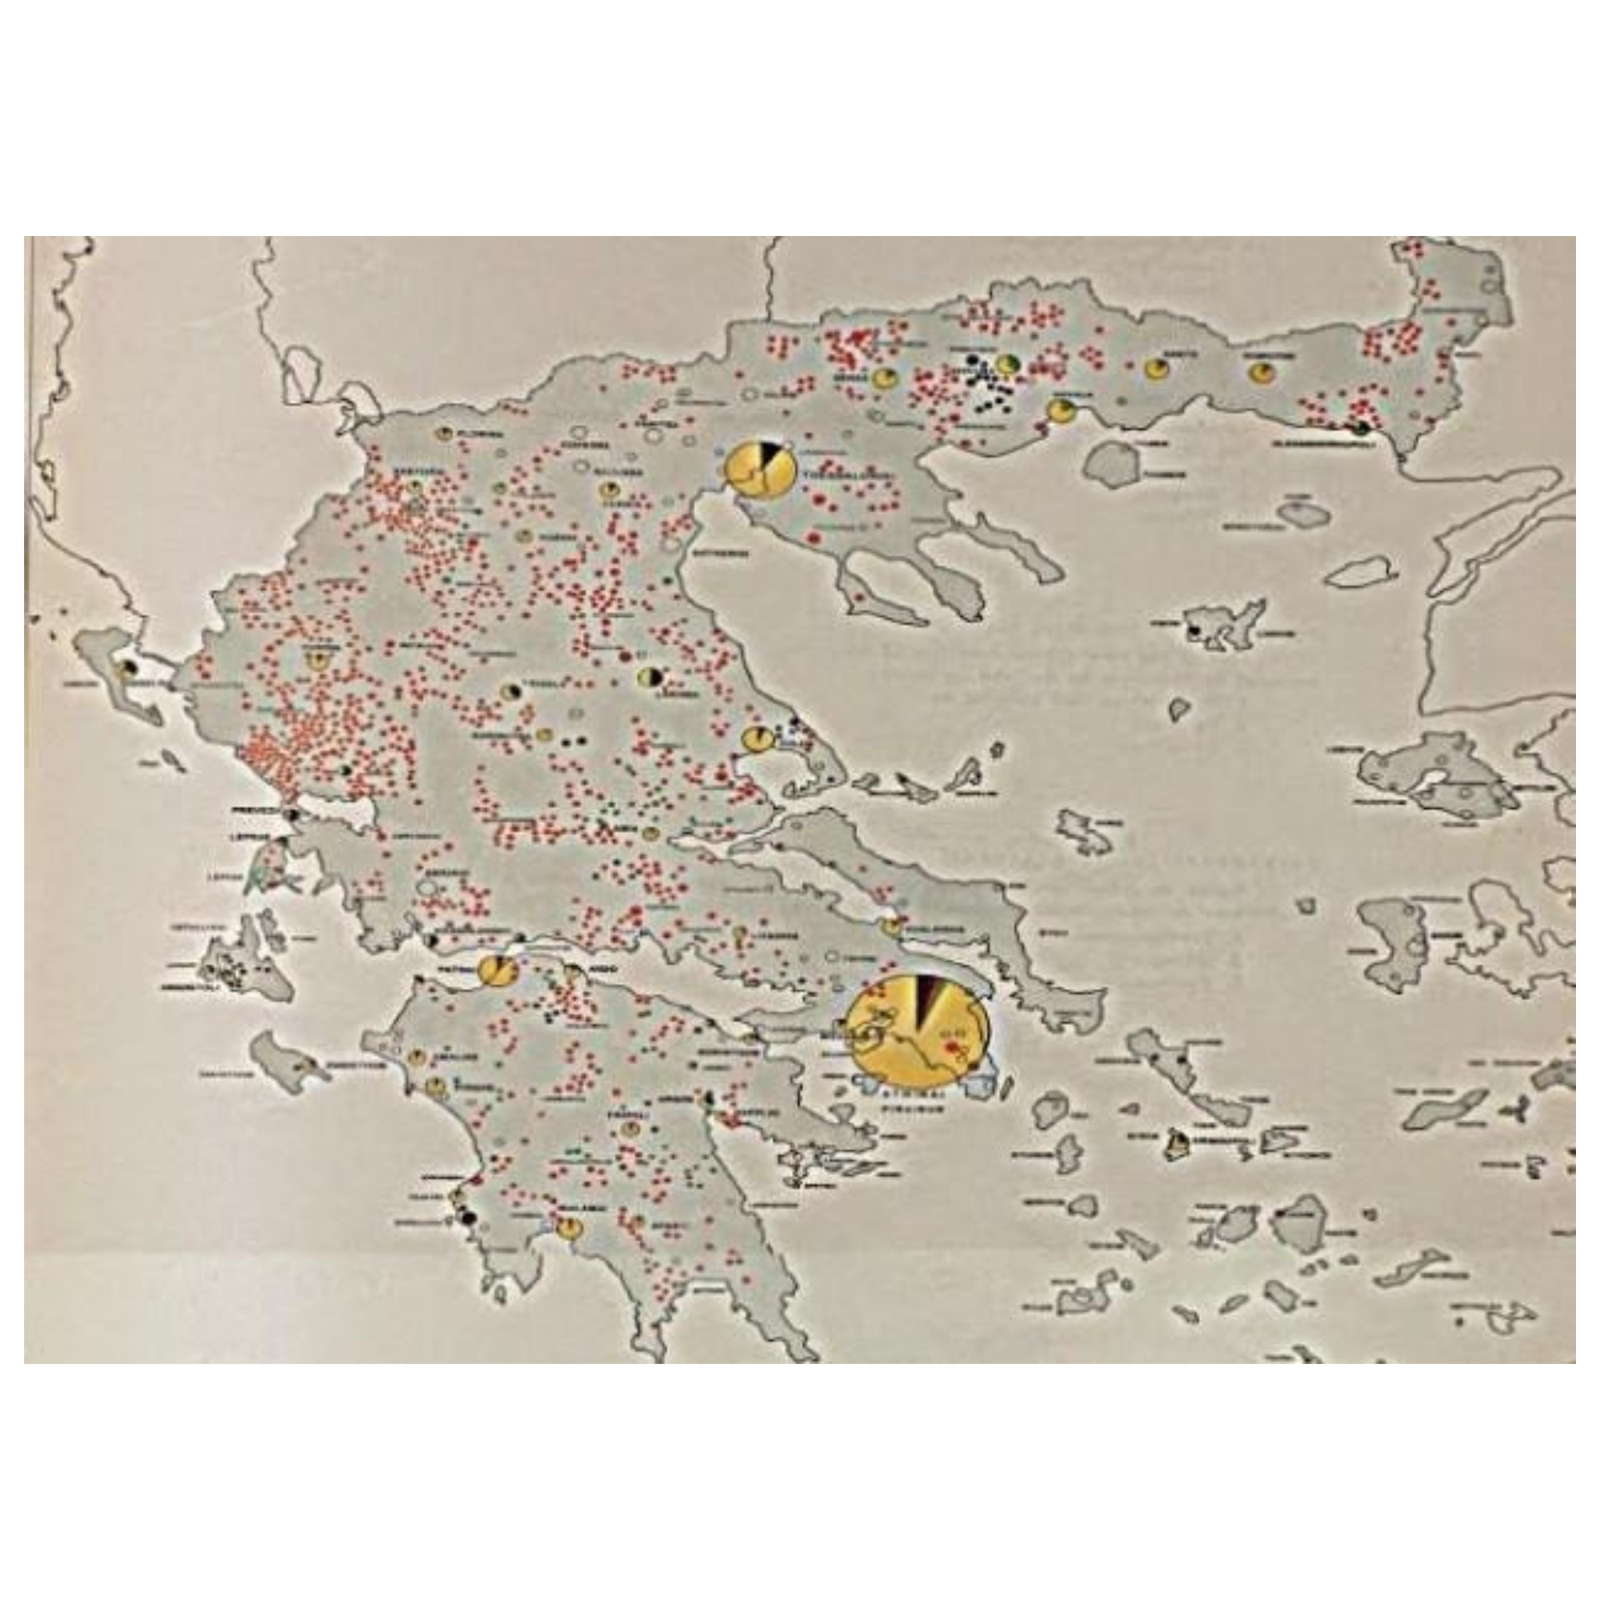
MAP (1946) With 1,770 Greek Villages (red dots) Razed During the Occupation
The report of the Doxiadis Committee (Greek Ministry of Public Works), The Sacrifices of Greece in the Second World War, presented in April, May, and June 1945 in Paris, London, and the United Nations, respectively, described an 800% increase in population mortality.
It also reported that thousands of children—“so ravaged by hunger they were little more than skeletons—unable to move, unable even to speak”—were found in many parts of Greece by members of the Committee.
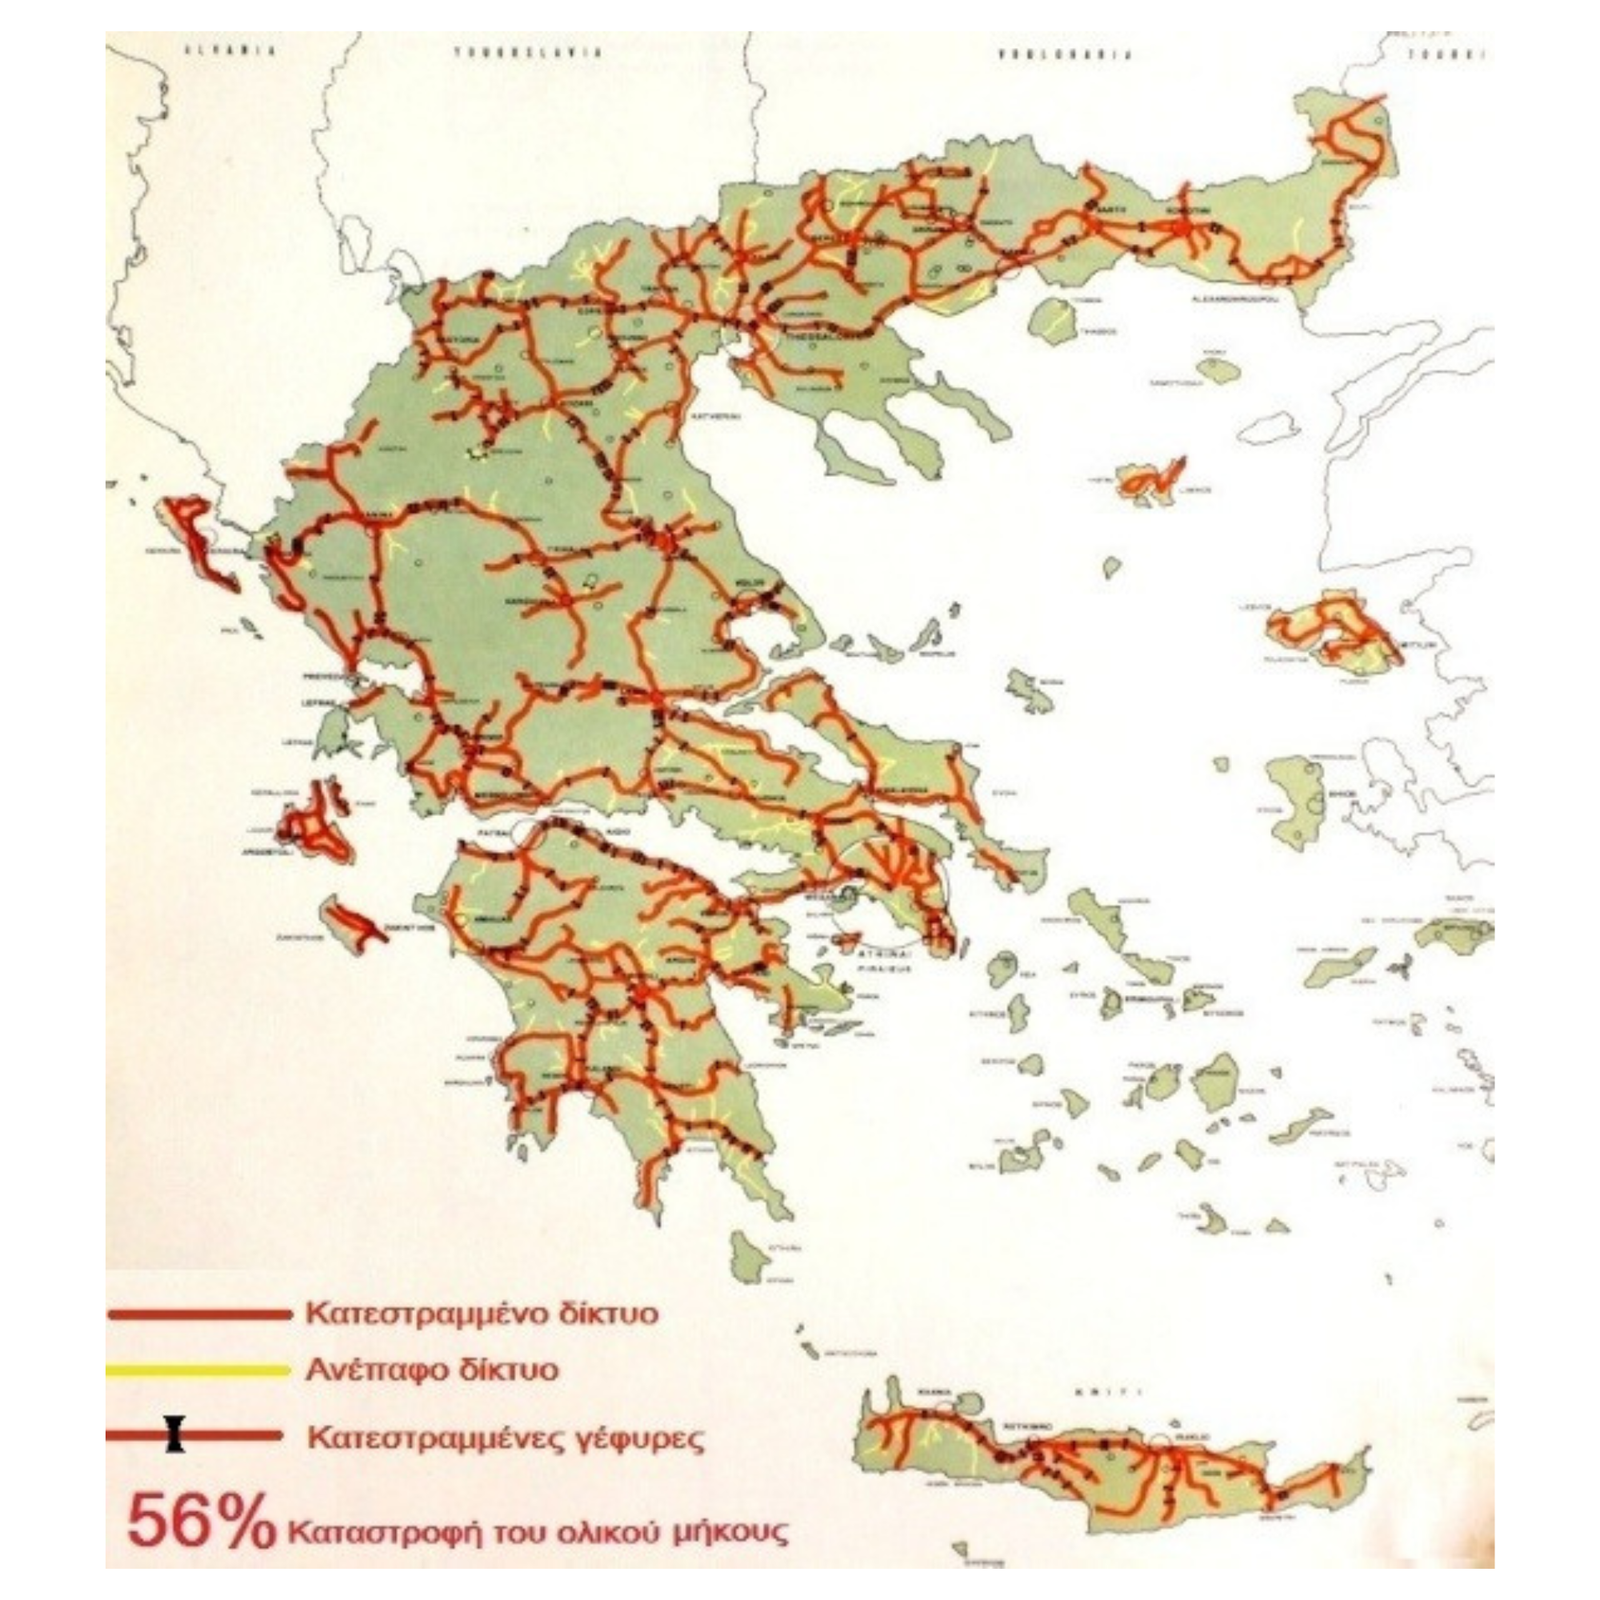
DESTRUCTION OF TRANSPORTATION SYSTEM
DESTRUCTION OF TELECOMMUNICATIONS SYSTEM
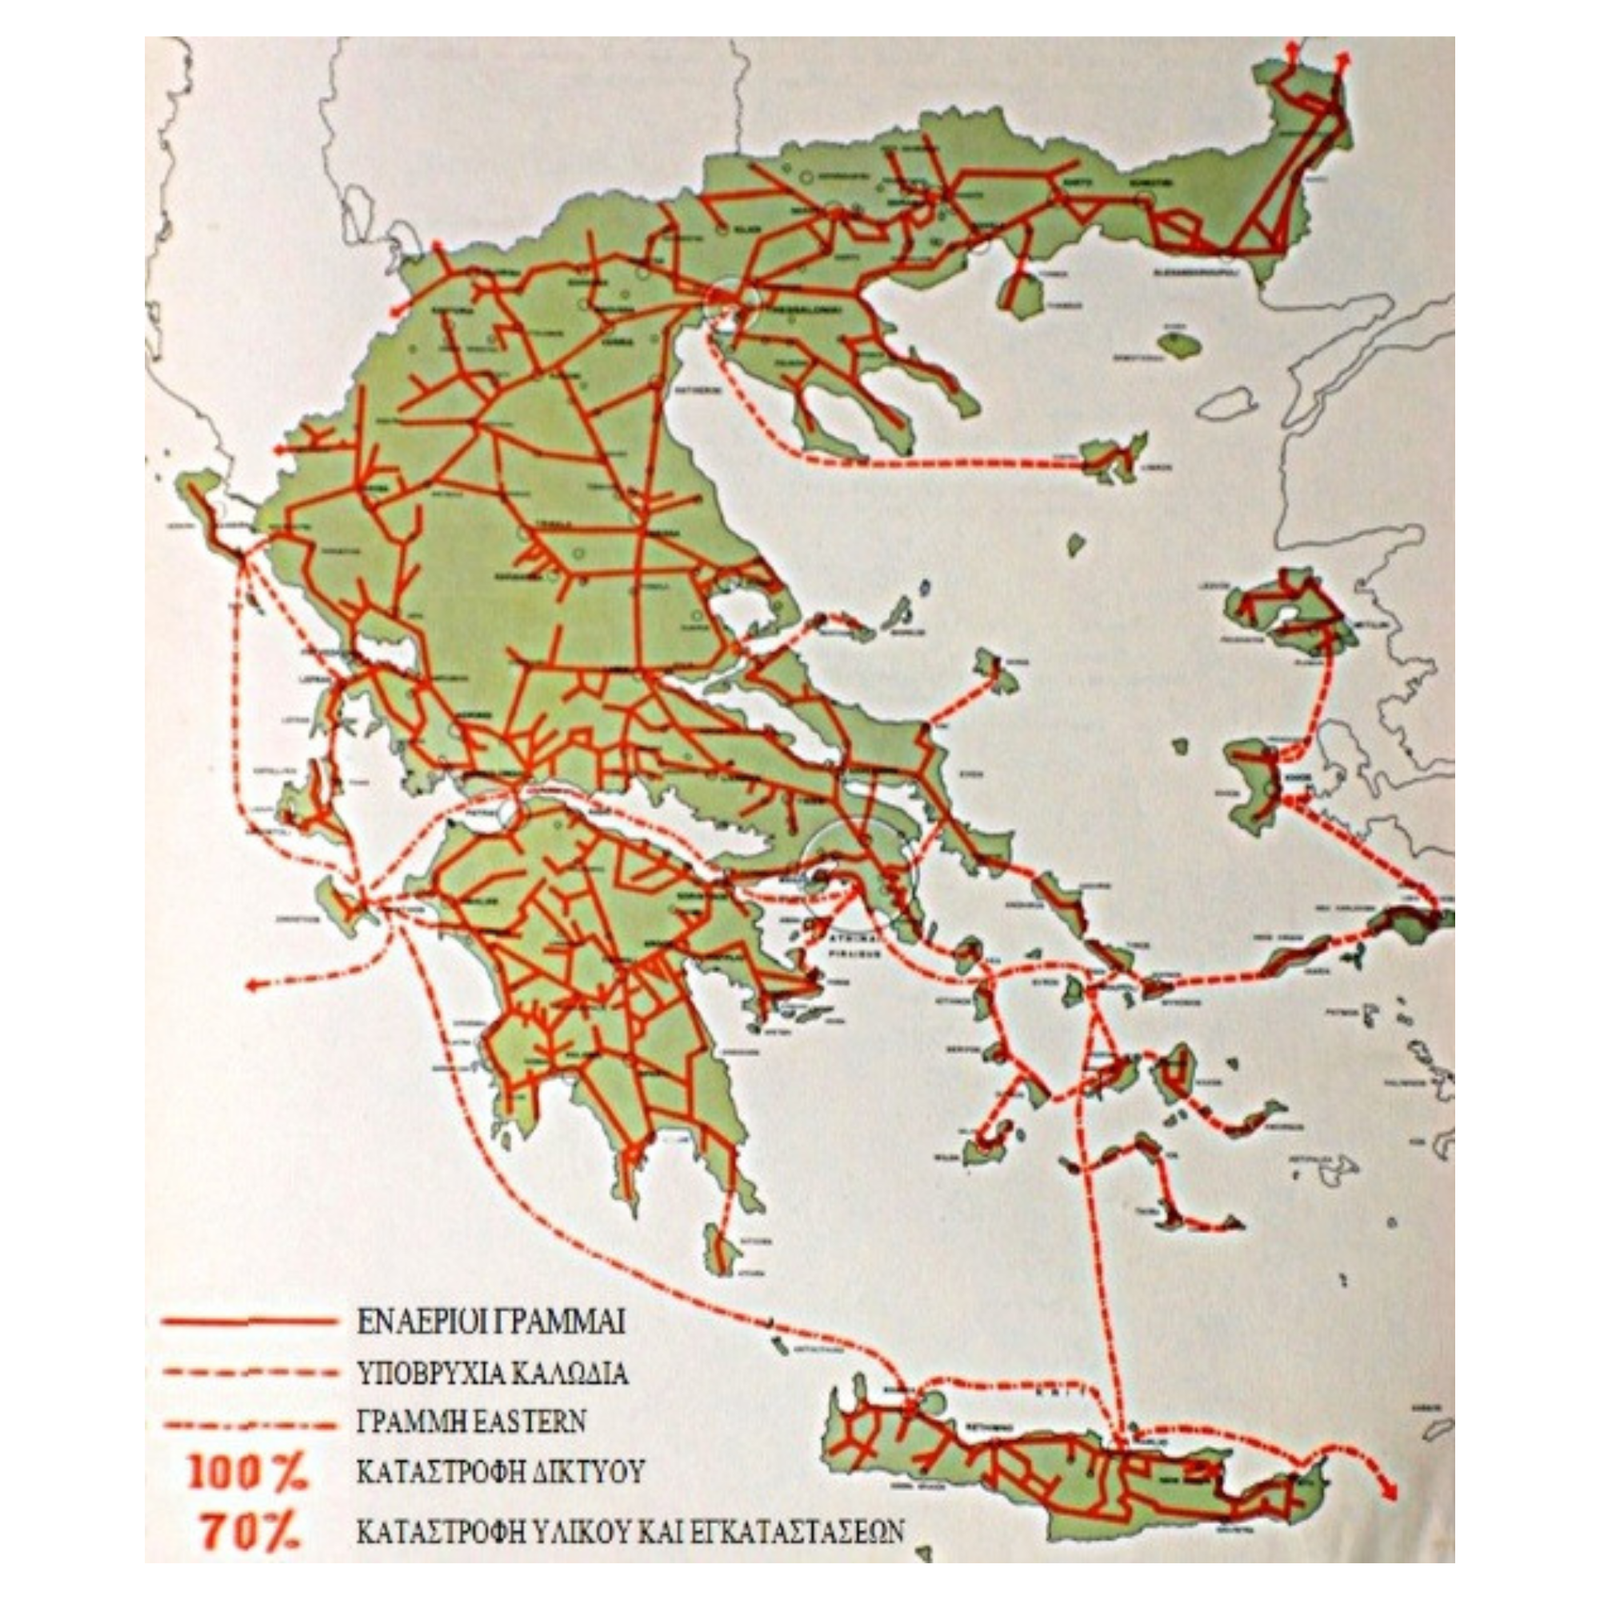
Major destruction caused by German forces
- Road and rail networks
- Telecommunications and irrigation systems
- Ports
- Civil aviation
- The Corinth Canal
- 74% of cargo ships and 95% of passenger ships
- 25% of all buildings
- Mines
Documented declines
- Agricultural output: –75%
- Livestock (small and large): –80%
- Forests: –25%